Inside
|
Global Warning RAFIQUE AHMED revisits the link between climate change and human activity
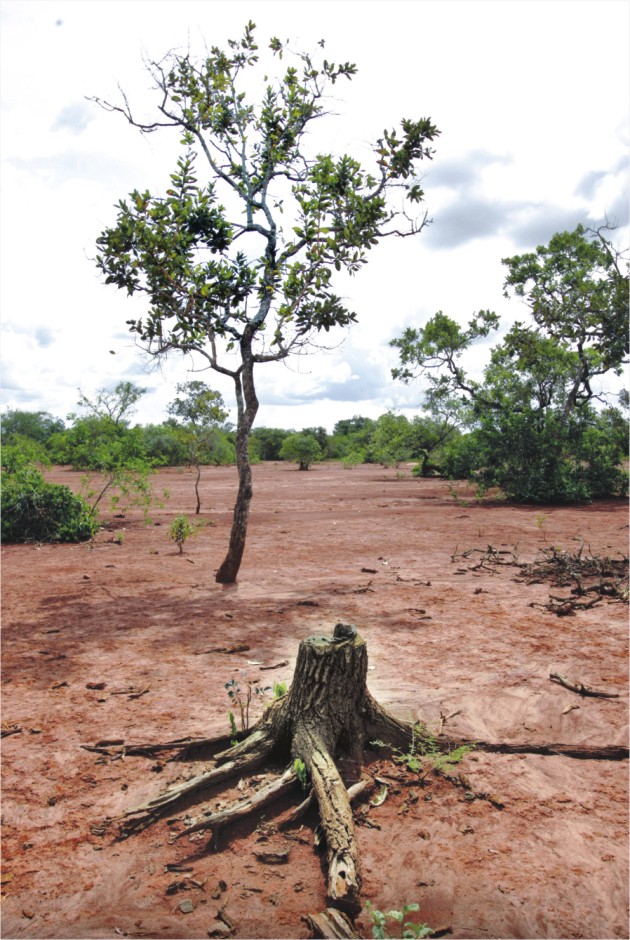
Since the early 1980s, the greenhouse effect and global warming have captured the attention of the scientific community, politicians, and news media all over the world. Global warming refers to the increase in the earth's surface temperature since the late 20th century and its projected continuation to the end of the 21st century. Several reports published by the Intergovernmental Panel on Climate Change (IPCC) have attributed this warming to the increase in atmospheric greenhouse gases, particularly increase in carbon dioxide (CO2) due to human activity (fossil fuel burning). However, there is also strong opposition to the views and positions taken by the IPCC on global warming and climate change. This debate has accelerated since the publication of several reports by the IPCC, especially after the publication of the Third and Fourth Reports (2001 and 2007). IPCC report summary on global warming -Most of the warming observed over the last 50 years is attributable to human activities, in particular emissions of the greenhouse gas carbon dioxide. -If greenhouse gas emission continues, the climate models predict that the earth's temperature will continue to rise, reaching 1.4oC 5.8oC by the year 2100. Almost all climate scientists agree with the first point, but the other two points -- the cause of global warming and model prediction of future temperature trend -- are points of great disagreement. Other effects of global warming include: Atmospheric energy source and the greenhouse process It is apparent that the atmosphere is a poor absorber of solar radiation (absorbs only 20 per cent). In fact, the earth's surface is the major source for the heating of the atmosphere. After being heated by the insolation, the earth's surface emits radiation in long waves (4-70 micrometres), called outgoing long wave radiation. It may be noted that one micrometre is equal to one millionth of one metre. Greenhouse gases and the greenhouse effect: Now let us examine how long wave radiation from the earth's surface heats up the atmosphere. The long wave radiation emitted by the earth's surface is absorbed efficiently by the greenhouse gases, such as water vapour (H2O), carbon dioxide (CO2), ozone (O3), and methane (CH4), and thereby they contribute to the heating of the atmosphere. This mechanism of "heat trapping" in the atmosphere by the greenhouse gases is known as the greenhouse effect. Because of the greenhouse effect, the earth's global/annual average surface temperature is 15oC. Without the greenhouse effect, earth's global/annual average surface temperature would have been only 18oC. Among the greenhouse gases, water vapour is the single largest greenhouse gas in the atmosphere (average: 2 per cent by volume), followed by carbon dioxide as a far distant second (0.0385 per cent), methane as the third (0.00017 per cent), and ozone concentration is even much smaller (0.00006 per cent). Changes in atmospheric CO2 concentration: It is estimated that atmospheric CO2 concentration before the Industrial Revolution was 285-290 parts per million (ppm), which has been increasing since then. Measurement taken at the Mauna Loa Observatory in Hawaii shows that atmospheric CO2 has increased from 310 ppm in 1957 to 385 ppm in 2008. According to the IPCC reports, if the trend continues, the atmospheric CO2 concentration may reach 450 ppm by 2050. To give the proper perspective, present-day atmospheric CO2 value of 385 ppm is nothing but 0.0385 per cent of the atmosphere by volume, and the projected value of 450 ppm by 2050 is nothing but 0.045 per cent of the atmosphere by volume.
Carbon dioxide (CO2) cycle: The atmosphere contains 750 billion metric tons of CO2, and there is a continuous exchange of CO2 between the earth's surface and the atmosphere. In the long run, the flux of CO2 from the earth's surface to the atmosphere (upward flux) is equal to its return flux from the atmosphere to the surface (downward flux). Oceans are the largest reservoirs of CO2 (39,000 billion metric tons (BMT)), followed by soil (1,580 BMT) and vegetation (610 BMT). Oceans are also the largest sink (that is, the largest absorber) of CO2. On a global/annual basis, the total upward flux of CO2 is 207.9 billion metric tons (BMT) per year, of which 6.3 BMT per year come from fossil fuel burning, 1.6 BMT per year are due to land-use change, 50 BMT per year come from plant respiration, 60 BMT per year come from soil respiration, and 90 BMT per year come from the oceans. It is clear that fossil fuel burning (6.3 BMT per year) accounts for only 3.03 per cent of the total supply of CO2 from the surface to the atmosphere, and the rest of the atmospheric CO2 come from the natural sources (nearly 97 per cent). Greenhouse effects of various greenhouse gases: It was shown earlier that water vapour is the single largest greenhouse gas in the atmosphere (2 per cent by volume) and CO2 is the far distant second greenhouse gas (0.0385 per cent). It was also shown earlier that only 3 per cent of the CO2 come from fossil fuel burning. Among the top three greenhouse gases, water vapour absorbs in a much wider band of long wave radiation (4-8 micrometre and 12-70 micrometre bands), and CO2 absorbs in a narrow band (13-16 micrometre band), and ozone (O3) absorbs in a much smaller narrow band (9-10 micrometre). Because water vapour is the most dominant greenhouse gas in the atmosphere and because it absorbs in a much wider wave length band, water vapour has the single largest greenhouse effect among all the greenhouse gases. Now let us examine the partial contributions of various greenhouse gases to the greenhouse effect. Professor S. Fred Singer (Atmospheric Physicist and Emeritus Professor of Environmental Sciences, University of Virginia, and former Director of the US Weather Satellite Service) performed calculations to this effect. His work entitled: "Water vapor rules the greenhouse system: A closer look at the numbers" was published in 2001, and is available on the internet. His calculations show that water vapour alone contributes 95 per cent to the greenhouse effect, and all other greenhouse gases together contribute 5 per cent to the greenhouse effect. His calculations further show that the man-made portion of carbon dioxide contributes only 0.117 per cent to the greenhouse effect. This suggests a gross discrepancy between the scientific basis of the partial contributions of anthropogenic carbon dioxide to the greenhouse effect and IPCC claims of global warming caused by anthropogenic carbon dioxide. Earth's past 1,000-year temperature pattern shows two long cycles: According to Professor Jorgen Peder Steffensen of the University of Copenhagen, the earth's temperature reached the lowest point during the Little Ice Age in the last 8,000 years of earth's history. Earth's temperature during the Medieval Period was about 1.5oC warmer than the present-day temperature. Scandinavian Vikings settled in Greenland during this warm period, where they grew crops and raised animals. That is how Greenland got its name. When the climate changed for the worse during the Little Ice Age, the Vikings left Greenland, and moved farther to the west -- to North America. It may be pointed out that the Medieval Warm Period prevailed when coal burning was almost non-existent. So, anthropogenic CO2 due to fossil fuel burning is not responsible for the warmer climate during the Warm Medieval Period. Large-scale coal burning began with the beginning of the Industrial Revolution. Despite increasing uses of coal since the beginning of the Industrial Revolution, climate changed from Medieval Warm Period to the cold Little Ice Age (1400-1900). This cyclical change in climate is attributed to the natural cycle of the earth's climate. Opposition to IPCC's global warming and climate change First, the climate system consists of many interactive components such as the lithosphere (sphere of rocks), hydrosphere (sphere of water), cryosphere (sphere of ice), biosphere (sphere of living organisms), and atmosphere (sphere of air). Within each of these components there are sub-components (or sub-systems). For example, the lithosphere contains mountains, hills, lakes, plateaus, forests, grasslands, desert, etc. There are also sub-systems in other components of the climate system. However, the nature and behaviour of the individual components of the climate system, and their interactive relationships are not fully known. There are also other factors that affect global climate on short time-scales, from few years to few hundred years: -Observations show that earth's temperature anomaly trend from 1860 to 2000 corresponds much better to the 11-year sunspot cycle than to the CO2 anomaly. -There has been a rapid growth in the number and size of urban areas around the world since the 1970s. Because urban areas are much warmer than surrounding open/rural areas, and because almost all the weather stations are located in the cities, rapid growth in urbanisation since the 1970s has created a bias toward warmer temperatures. -Earth's temperature goes through natural cyclical variations. -Occasional major volcanic eruptions causes earth's temperature to drop 0.5- 1oC in the next 2-3 years. -Deep ocean conveyer belt circulation which has a periodicity of 200-500 years in the Atlantic Ocean, and 1,000-1,200 years in the Pacific Ocean. It may be noted that we have little understanding of how deep ocean circulation affects climate.
All these factors were not considered by the IPCC. Using tree ring data, Dr. Michael Mann of Pennsylvania State University, a leading scientist of the IPCC, reconstructed earth's temperature anomaly for the period from 1000 to 2000 AD, plotted as deviation from the 1961-1990 mean value. Because this graph has the appearance of an ice hockey stick, this graph is referred to as the "Hockey Stick Graph." The Hockey Stick Graph appeared so dramatic and so convincing that IPCC replaced the graph they had been using until 2000 with the Hockey Stick Graph in its Third and Fourth Reports (2001 and 2007, respectively). Since then the Hockey Stick Graph has cropped up all over the place. Al Gore also used the Hockey Stick Graph in his movie "An Inconvenient Truth." However, the Hockey Stick Graph contains two major flaws: -Earth's past temperatures were below normal from 1000 AD to the 1970s (for a duration of about 970 years). Later on it was found that the Hockey Stick Graph was drawn on the basis of a very small sample of tree ring data (10 out of 65 samples), and by data manipulation and statistical exaggeration. The Hockey Stick is only possible because the sample size was reduced from 65 samples to 10 samples, picked up selectively to make the graph very convincing that human activity is the cause of global warming. When a different set of 34 samples is used, the hockey stick disappears. That is why UN pulled the Hockey Stick Graph from the 2009 UN Climate Report -- prior to the Copenhagen conference. Instrumental observations of the earth's temperature began in 1875, near the end of the Little Ice Age. Based on instrumental data, US National Oceanic and Atmospheric Administration (NOAA) reconstructed earth's temperature anomaly from 1880 to 2007, plotted as deviation from the 1901-2000 mean value. This calculation shows a generally increasing trend since the late 19th century, which is quite natural because earth's temperature has been bouncing back from the cold Little Ice Age. Despite IPCC claims of "scientific consensus" and "mainstream support," tens of thousands of scientists oppose the IPCC claims of global warming and its prediction of future temperature increase. In fact, more than 31,000 US scientists, including 9,000 Ph Ds, signed a petition opposing the IPCC view on global warming and climate change. There are also opponents of the IPCC in other parts of the world. Some of the opposing views are given below. Professor Jorgen Peder Steffensen of the University of Copenhagen pointed out that instrumental measurement of temperature began in 1875, near the end of the Little Ice Age, when earth's temperature was lowest in the last 8,000 years. Accordingly, increasing temperature since the late 19th century is nothing unusual, and it is a part of the earth's natural cycle, because earth's temperature is bouncing back from the lowest temperature during the Little Ice Age. This view is also shared by many climate scientists. Professor Steffensen also pointed out that although earth's temperature is increasing, its present-day temperature has not yet reached the high temperature level of the Medieval Warm Period when it was 1.5oC warmer than the present-day temperature. Professor John Christy of the University of Alabama at Huntsville, a contributor to several IPCC reports, commented that there is neither a developing catastrophe nor the smoking gun proving that man-made carbon dioxide is to blame for the global warming. Dr. William Grey, professor emeritus and head of the Tropical Meteorology, Colorado State University, ascribed this warming to the natural alterations in deep ocean circulations which are driven by the ocean salinity variations of which we have very little understanding. He also added that humankind has little or nothing to do with ocean temperature changes. Dr. David Legates, associate professor of Geography and director of the Center for Climate Research, University of Delaware, and the climatology editor of the Physical Geography journal, maintains that about half of the 20th century warming occurred prior to the 1940s, and natural variability accounts for all or nearly all of the warming. Many climate scientists have concluded that model projections of future climate change over the next 50-100 years is based on insufficiently verified climate models, and are therefore not considered reliable. Like many meteorologists and weather forecasters, Dr. Neil Frank, former director of US National Hurricane Center, made an observation saying that the numerical models of weather forecasting cannot make accurate 5-day to 10-day weather forecasts. Then, how do we believe in 50-100 year temperature forecasts? Dr. Richard Lindzen, professor of Atmospheric Sciences at MIT and a member of the US National Academy of Sciences, concluded that we cannot confidently attribute past climate change to increased carbon dioxide, or cannot forecast what the climate will be in the future. Computer models do what they are programmed to do. Dr. Freeman Dyson, emeritus physics professor, Princeton University, has pointed out that one can learn a lot from computer models, but cannot learn what's going to happen 10 years from now. Recent evidence Once in a while we also see statements from the IPCC and pro-global warming scientists that earth's temperature is rising faster and glaciers are melting faster than predicted. That too tells us that there is something wrong with the climate models. A recent study done at the University of Alabama at Huntsville and UK's Hadley Centre shows a decreasing trend in global temperature since 2003. The US National Weather Service recently published a graph showing the decadal frequency of all-category hurricanes (tropical cyclones) that made landfall in the US mainland from the decade 1851 to the present decade (decade of 2001). This graph shows inter-decadal fluctuations in the occurrences of all-category hurricanes, but does not indicate any trend. The intensity of tropical cyclone is expressed by the accumulated cyclone energy (ACE), which is a measure of the kinetic energy of a cyclone. A study done at Florida State University on global ACE values from 1980 to 2008 shows that ACE values have been decreasing since 1994, and in fact 2008 marked the lowest global ACE value. Although IPCC claimed that Antarctica will lose 40 per cent of its ice as early 2050, a recent study done at the Atmospheric Science Department, University of Illinois at Urbana-Champaign, shows that Antarctic ice cap has been fluctuating about its mean value since 1978, and has been growing since 2003. The IPCC report of 2007 claimed that Himalayan glaciers will vanish by 2035. But according to a report published in the Discovery News magazine, May 5, 2009, the Himalayan glaciers have been growing since 1980. This report was based on a study conducted by a team of glaciologists led by Dr. John Shroeder of the University of Nebraska-Omaha, using satellite imagery of the glaciers of the Himalayan region since 1960. Recent developments On October 19, 2009, some computer hackers leaked out thousands of documents and emails from the Climate Research Unit (CRU) of East Anglia University. CRU is one of the IPCC centres for research on global warming and climate change. Some of the revealed documents were published in the newspapers and discussed in TV shows in the West, including UK and other European countries, US, Canada, Australia New Zealand, etc. These revelations were labelled as "ClimateGate." These leaked documents reveal exchanges between top IPCC climate scientists in the UK and in the US. These disturbing documents revealed that they threw away raw data, and replaced them by "manufactured" data since 1980s to enhance the perception that man is causing global warming through the release of carbon dioxide (CO2). Another reason for using the manufactured data was to hide the observed temperature decline since 1980s. These documents also revealed how the pro-global warming scientists marginalised and silenced their opponents and critics, which was done in two ways. First, the believers gained control of the main climate-profession journals. That was how they blocked the publication of papers written by the skeptics. Second, the skeptics were demonised through false labeling and false accusations. In one of the ClimateGate revelations Dr. Kevin E. Trenberth, a lead author of the IPCC Reports lamented: "The fact is that we can't account for the lack of warming at the moment and it is a travesty that we can't. Our observation systems aren't able to comprehensively keep track of where all the energy is going. Consequently, we can't definitively explain why surface temperatures have gone down in the last few years. That's a travesty!" ClimateGate documents also revealed that some US government agencies like US National Climatic Data Center (NCDC) and Nasa's Goddard Institute for Space Studies (GISS) systematically eliminated 75 per cent of the world's stations (used only 1,500 out of nearly 6,000 stations) creating a strong bias toward warmer temperatures. Climate gate On December 5, 2009, a group of US physicists wrote to the American Physical Society to change its policy statement on Climate Change from "The evidence is incontrovertible: Climate change is occurring" to "Current climate models appear insufficiently reliable to properly account for natural and anthropogenic contributions to past climate change, and much less project future climate." On the same day, the US National Academy of Sciences stated: "ClimateGate is equal to Scientific Misconduct." Because of IPCC's erroneous projections of global temperature increase based on insufficiently verified climate models which, in turn, is based on our inadequate knowledge about the nature and interactive relationships of the climate components, IPCC's use of falsified data, data manipulation tricks, secretive activity, marginalisation and intimidation of its critics, etc and the aftermath of the ClimateGate revelations, the image of the IPCC has been tarnished tremendously -- resulting in a gross erosion of the trust and confidence in IPCC. Copenhagen At the last moment, as a face-saving device, five countries namely US, China, India, Brazil and South Africa came up with a two page long non-binding agreement, called "The Copenhagen Accord." This accord emphasised the scientific case for keeping Earth's temperature increase to no more than 2oC, but does not contain commitments to emissions reductions to achieve that goal. It is worth noting that among the signatories, US was the only industrial country that signed this agreement. Surprisingly, the host country Denmark did not sign this accord. What next? Whether that goal is achievable or not remains to be seen. It appears that, there is a push for reducing the carbon emission to the pre-Industrial level (285-290 ppm). The question is: How do we know that the Earth had its best climate during the pre-Industrial period? Since IPCC credibility is now on a very shaky ground, future global climate change agreement will depend, in part, on what additional damaging information come out of the ClimateGate revelations before the next climate change summit, and what IPCC does to regain its reputation, credibility, and trust. The US has recently adopted a new energy policy, which includes provisions for more drilling for oil and gas, use of clean coal, and nuclear energy. Energy conservation and increased energy efficiency will reduce the consumption of fossil fuels. These, together with clean fossil fuel technology will reduce carbon emissions. However, questions arise whether renewable energy sources alone can supply the world's total energy needs, and whether there will be any inadvertent adverse environmental consequences due to the global-scale uses of renewable energy sources. Rafique Ahmed, PhD, is Professor of Climatology, Department of Geography & Earth Science, University of Wisconsin-La Crosse.
|